
Shareholders and Investors
Main Figures
Main Figures
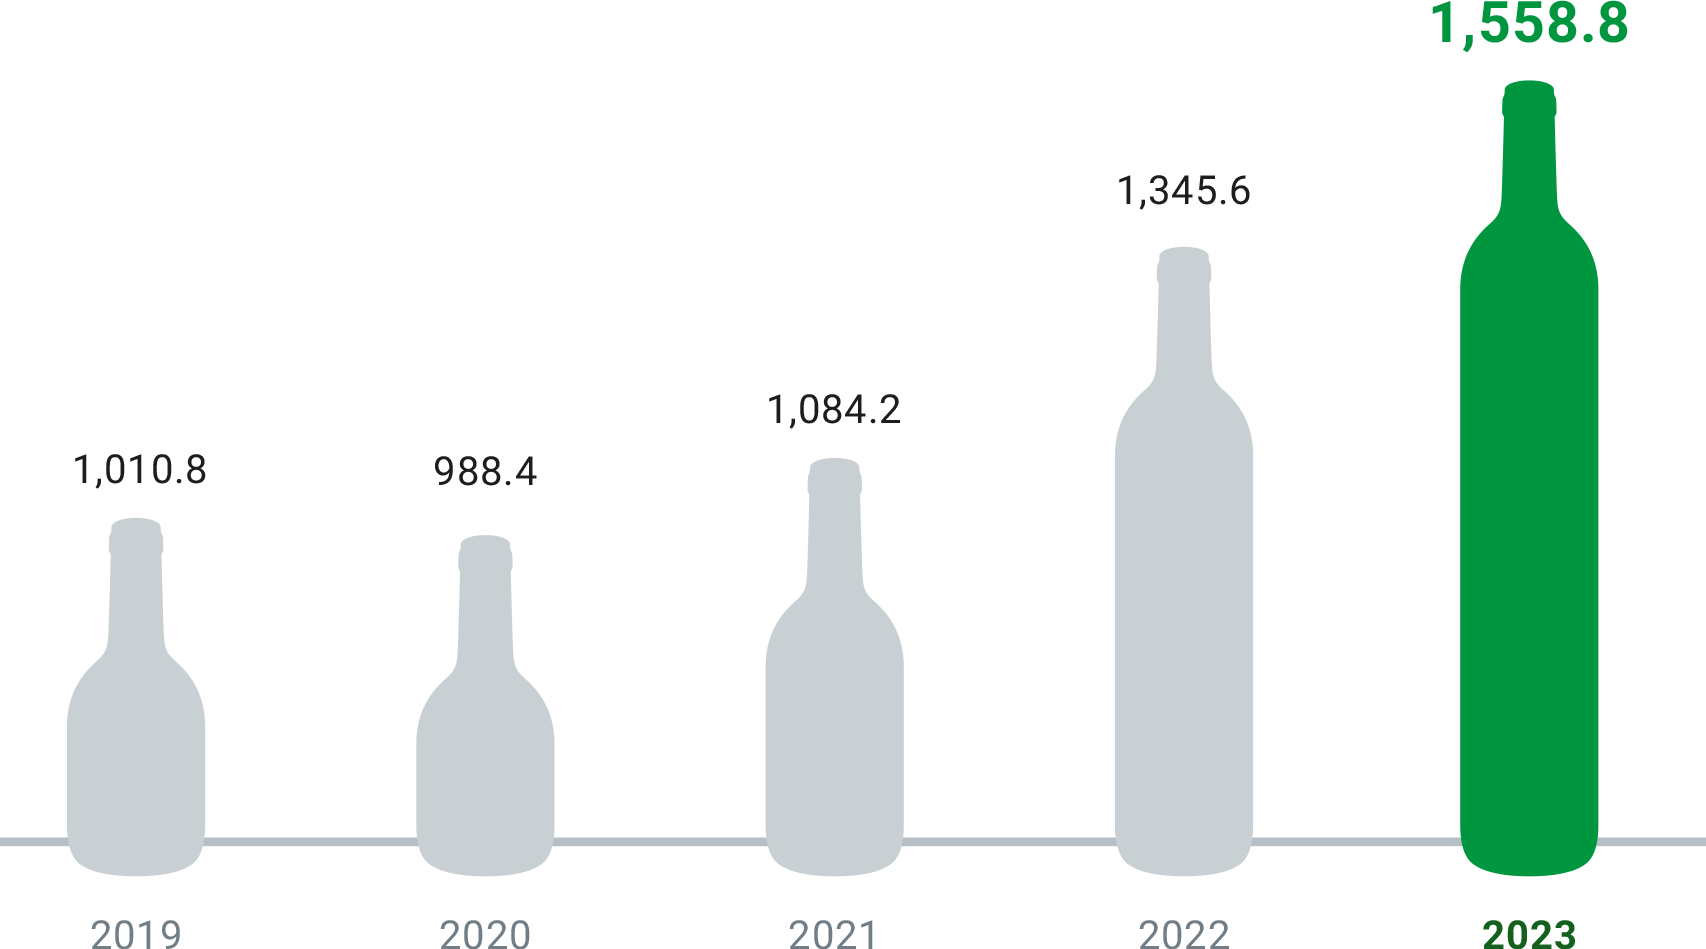
Sales
EUR million.
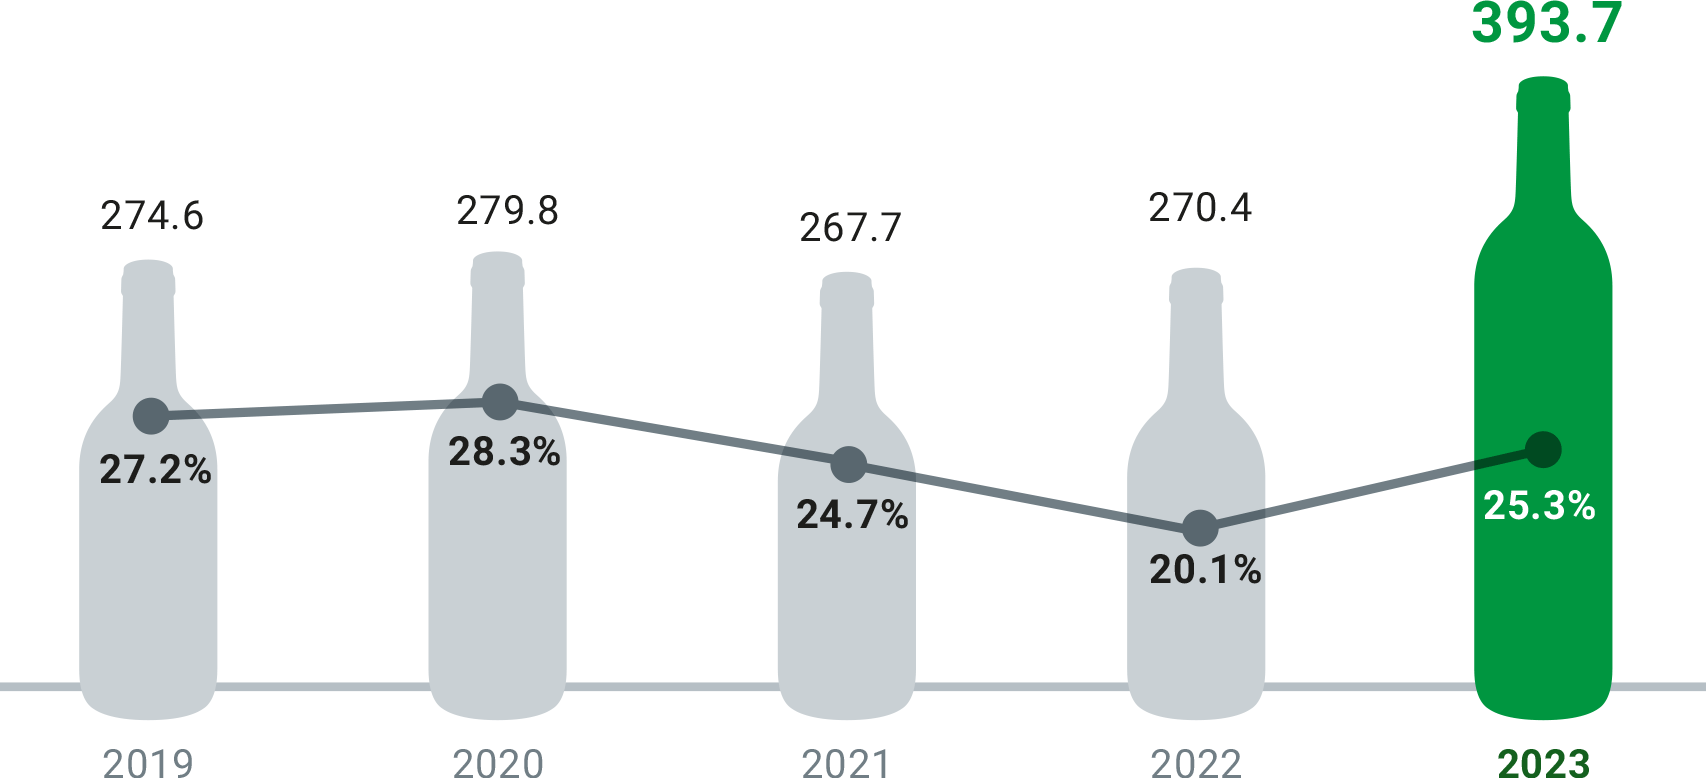
Operating income (EBITDA)
EUR million and percentage of sales.
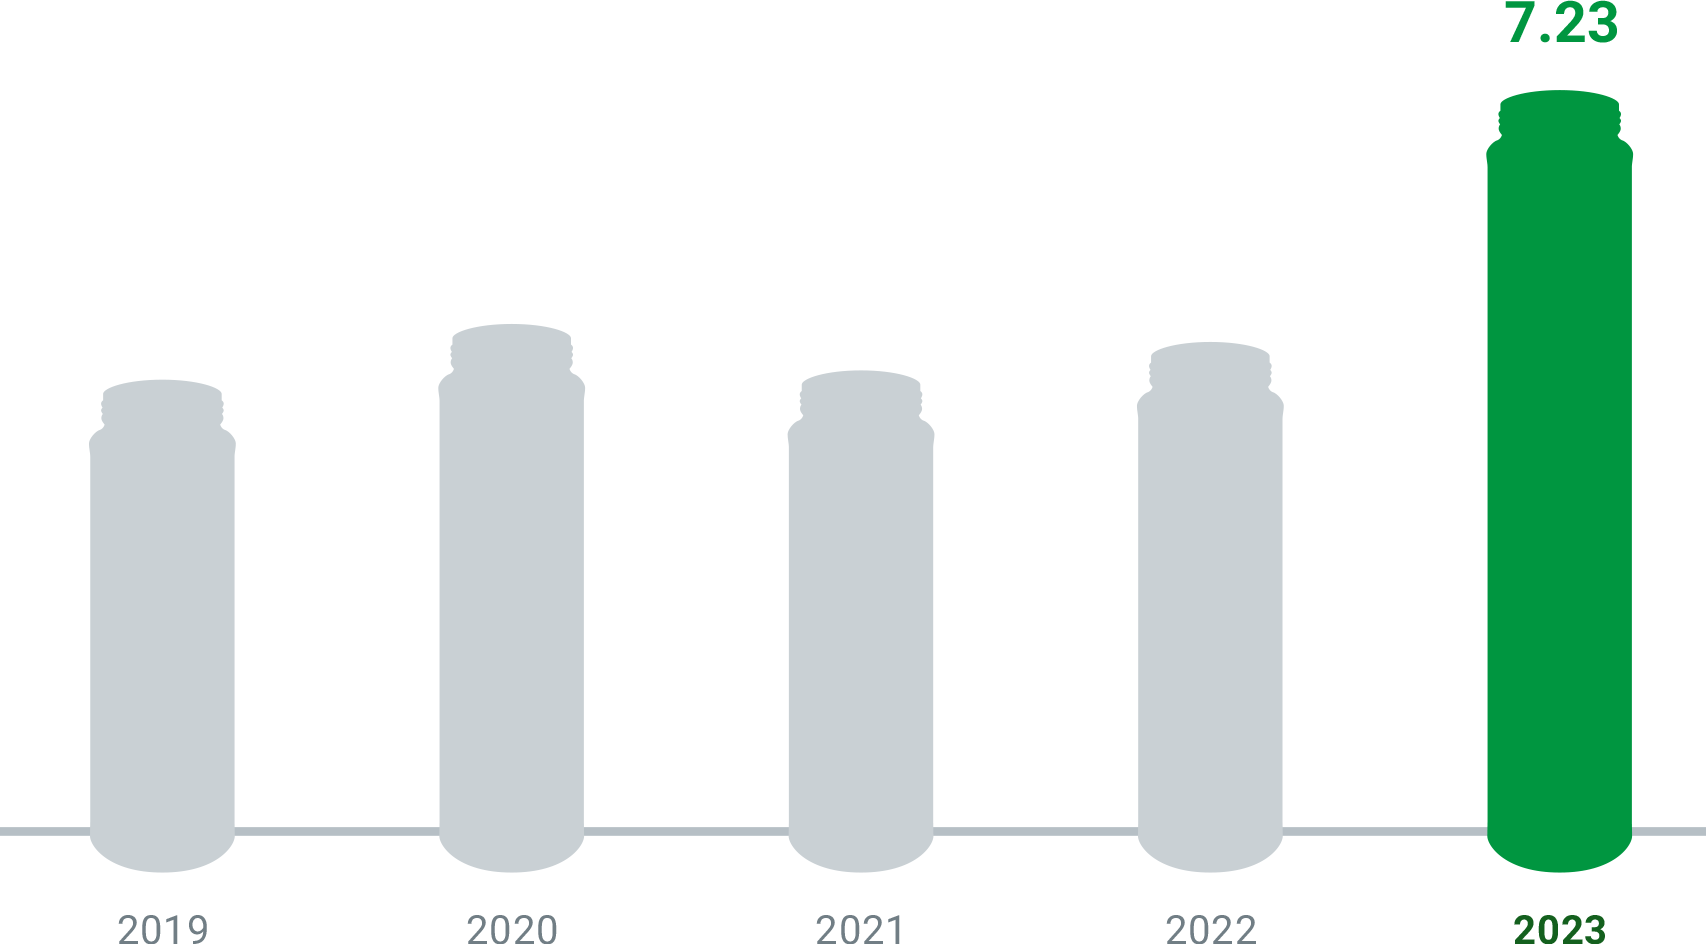
Earnings per share
EUR per share.
Cash dividends (including AGM attendance bonuses)
EUR million.
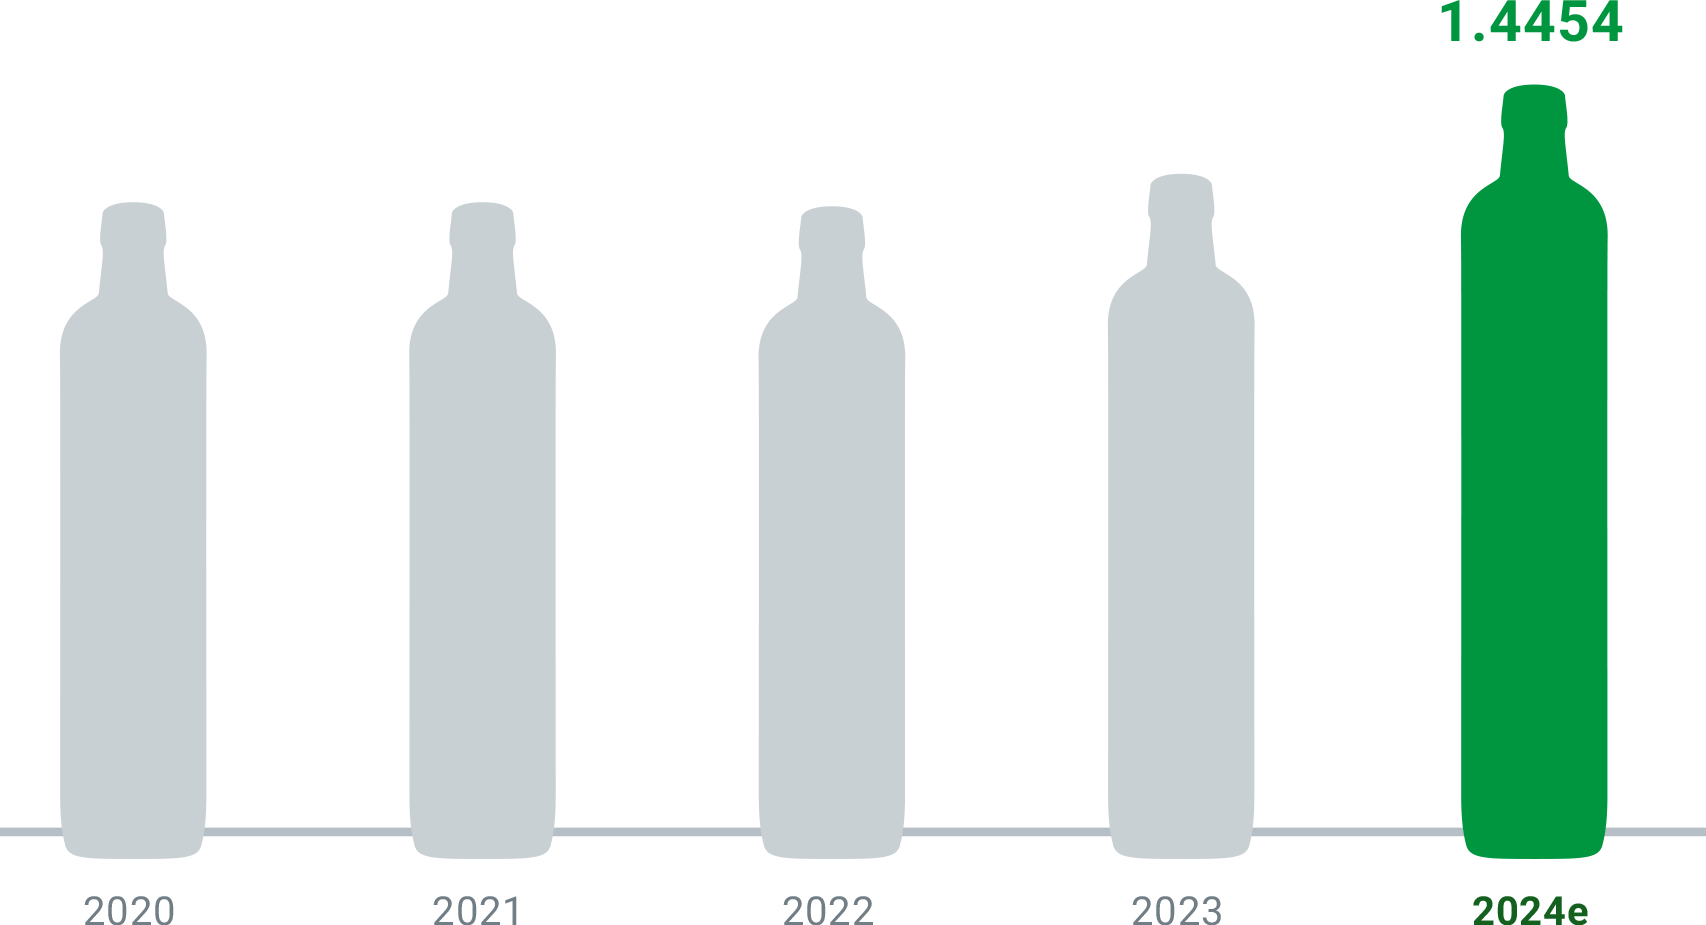
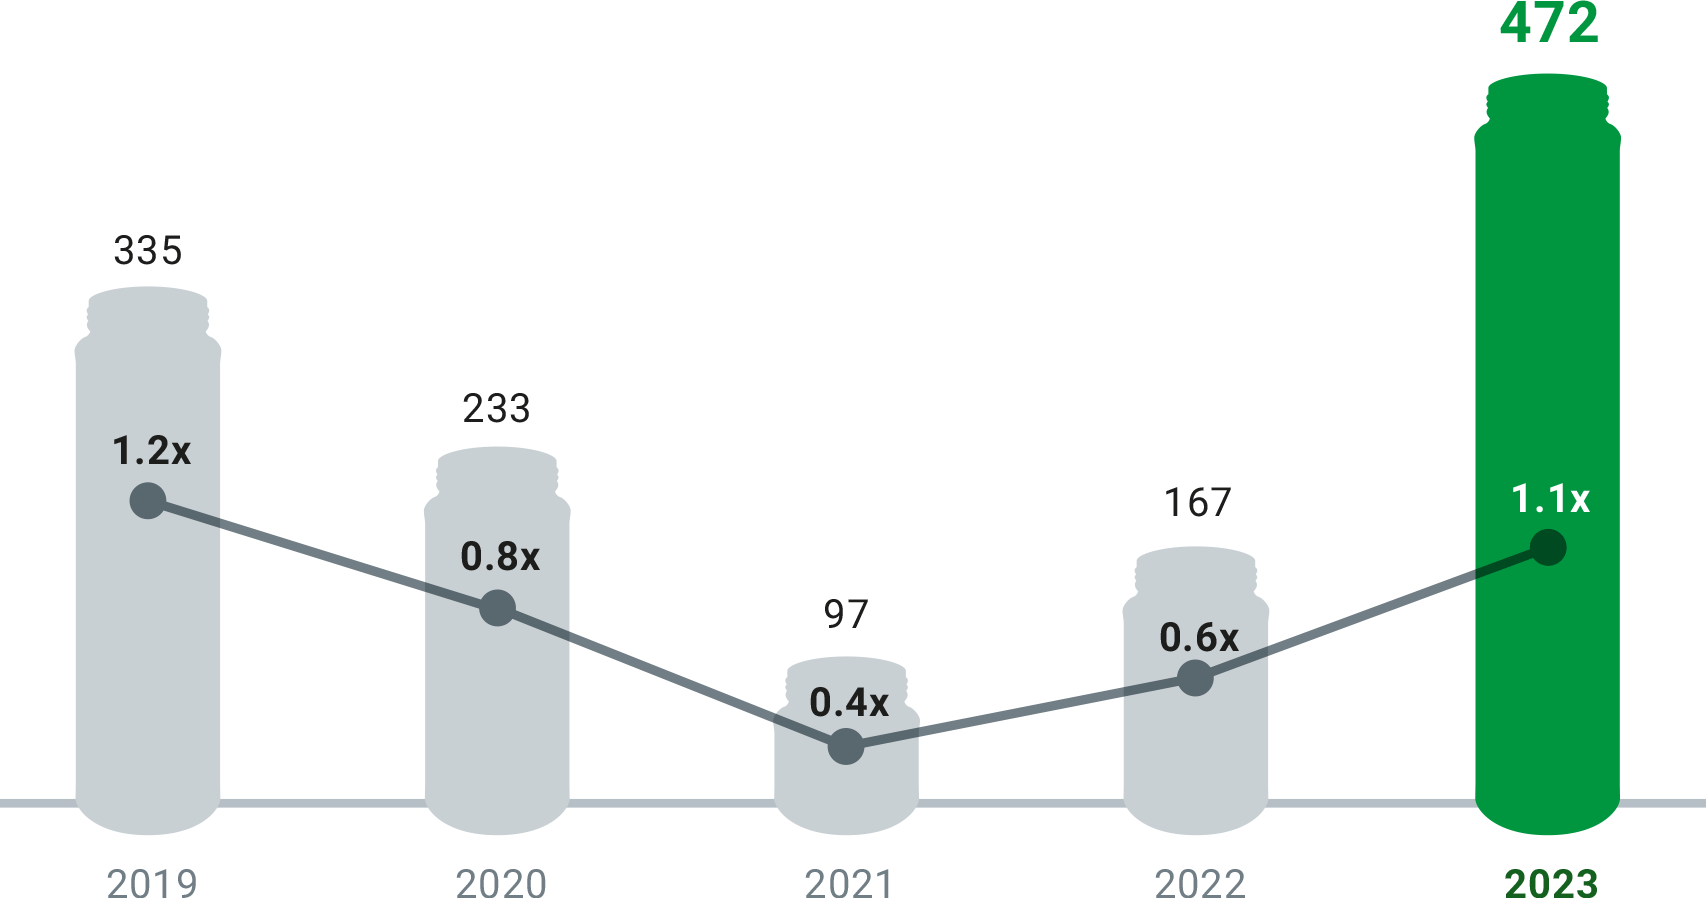
Debt
EUR million and times EBITDA.
Relevant figures
↔
|
|
|
|
|
|
|
|
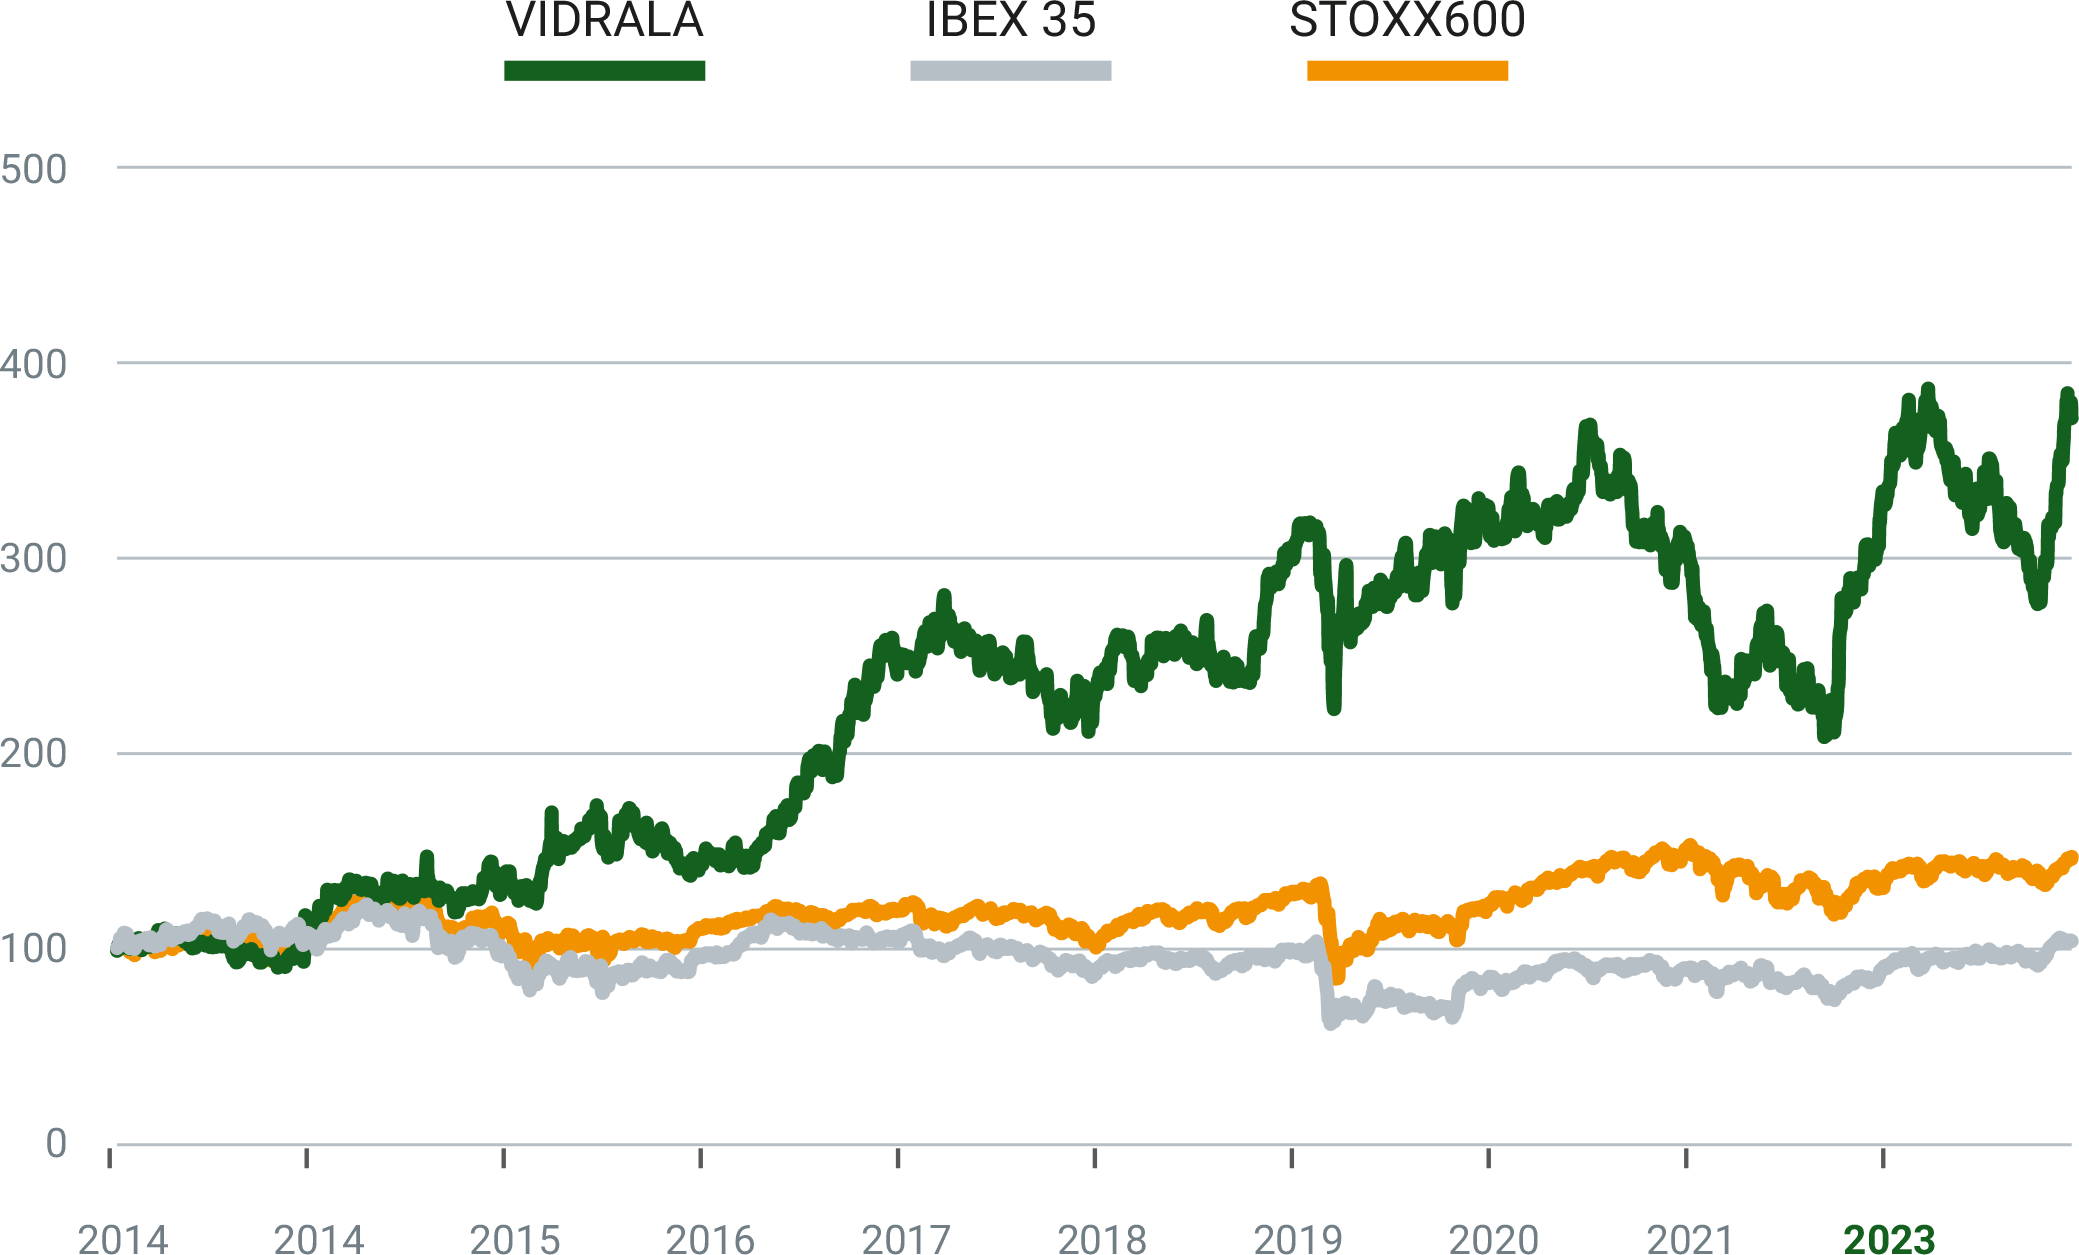
Share price
Comparative performance in percentage terms, base 2014.
-
Sales in the year 2023 amounted to EUR 1,558.8 million, showing an organic growth of +15.3%.
-
Operating profit, EBITDA, amounted to EUR 393.7 million representing an operating margin of 25.3%.
-
Earnings per share increased +53.5% over the same period last year, to EUR 7.23 per share.
-
Net debt as of December 31, 2023 stood at 472.2 million, equivalent to 1.1x times last twelve months pro-forma EBITDA.